Functions and Graphs: Domain, Range, and Transformations | ACT Math Guide
Understanding functions and their graphs is fundamental to success on the ACT Math section. Whether you’re determining the domain and range of a function or visualizing how transformations shift graphs, mastering these concepts will help you tackle multiple question types with confidence. This comprehensive guide breaks down everything you need to know about domain, range, and function transformations, complete with step-by-step examples and proven test-taking strategies.
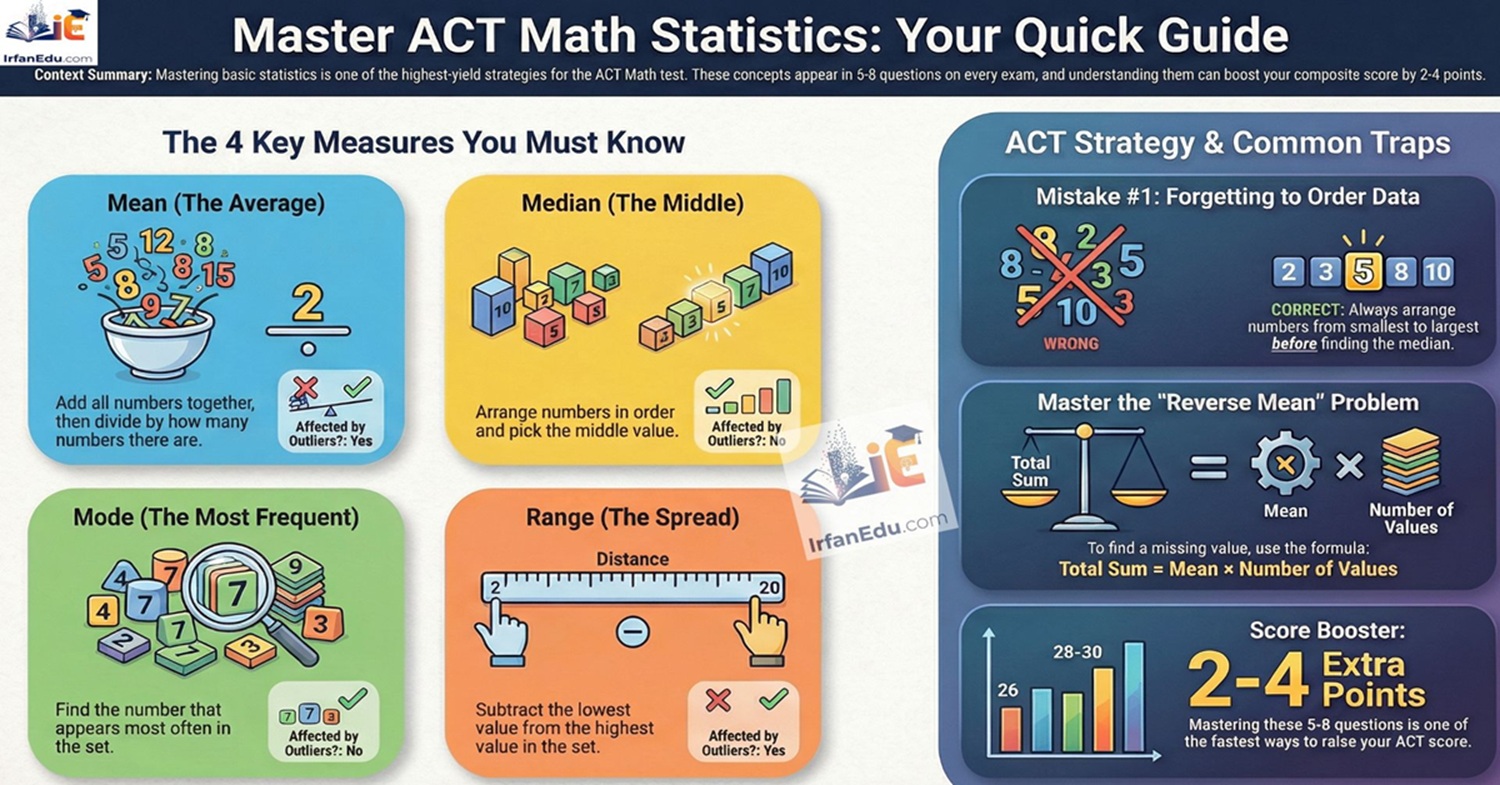
ACT SCORE BOOSTER: Master This Topic for 2-4 Extra Points!
Functions and graphs appear in 5-8 questions on every ACT Math section. Understanding domain, range, and transformations thoroughly can add 2-4 points to your composite score. Let’s break it down with proven strategies that work!
🚀 Jump to ACT Strategy →📚 Understanding Functions and Graphs for ACT Success
Functions are mathematical relationships where each input produces exactly one output. On the ACT, you’ll encounter questions about function notation, domain and range, and how graphs transform when functions are modified. These concepts appear consistently across multiple questions, making them essential for achieving your target score.
The beauty of functions lies in their predictability. Once you understand the fundamental patterns of how functions behave, you can quickly analyze graphs, determine valid input and output values, and predict transformations. For comprehensive strategies on tackling these and other intermediate algebra topics, explore our ACT prep resources.
According to the official ACT website, intermediate algebra questions constitute approximately 15-20% of the Math section, with functions and graphs being a significant component. Let’s dive into the essential concepts you need to master.
📐 Essential Concepts: Domain, Range, and Transformations
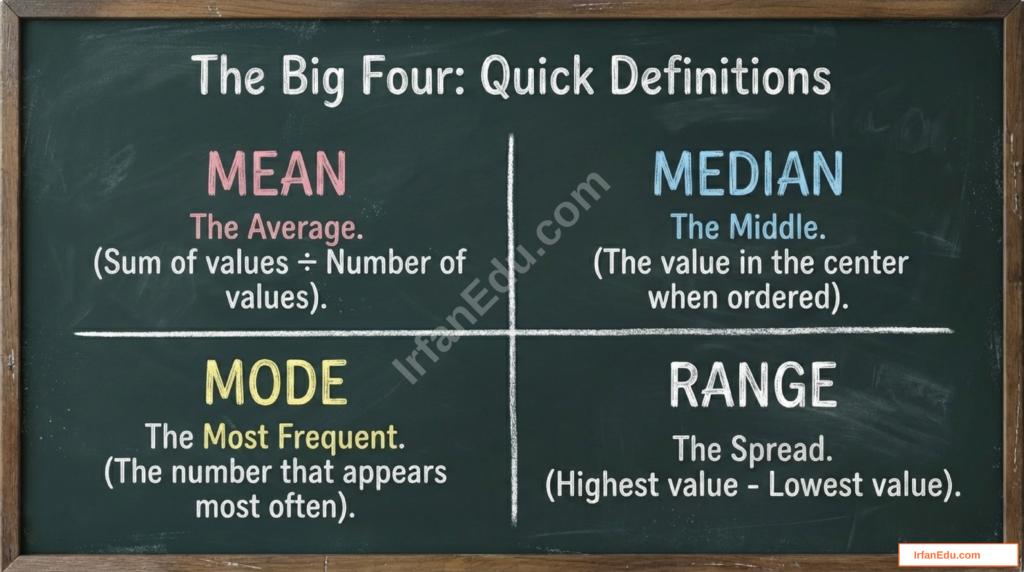
🔑 Core Definitions & Formulas
Domain
The domain is the set of all possible input values (x-values) for which a function is defined.
Key restrictions:
• Division: Denominator cannot equal zero
• Square roots: Expression under $$\sqrt{}$$ must be ≥ 0
• Logarithms: Argument must be > 0
Range
The range is the set of all possible output values (y-values) that a function can produce.
Function Transformations
Given parent function $$f(x)$$:
- $$f(x) + k$$: Vertical shift up by k units
- $$f(x) – k$$: Vertical shift down by k units
- $$f(x + h)$$: Horizontal shift left by h units
- $$f(x – h)$$: Horizontal shift right by h units
- $$a \cdot f(x)$$: Vertical stretch if |a| > 1, compression if 0 < |a| < 1
- $$-f(x)$$: Reflection across x-axis
- $$f(-x)$$: Reflection across y-axis
Understanding Domain Restrictions
Finding the domain requires identifying values that would make the function undefined. Here’s a systematic approach:
- Identify potential restrictions in the function (division, square roots, logarithms)
- Set up inequalities or equations based on these restrictions
- Solve to find which values are excluded
- Express the domain using interval notation or set notation
Determining Range from Graphs
The range is often easier to determine visually from a graph. Look at the lowest and highest y-values the function reaches. For algebraic functions, consider the function’s behavior, transformations, and any maximum or minimum values.
✅ Step-by-Step Examples with Solutions
Example 1: Finding Domain with Restrictions
Question: Find the domain of $$f(x) = \frac{3x + 2}{x^2 – 9}$$
Step 1: Identify restrictions
The function has a denominator, so we need to find where $$x^2 – 9 = 0$$
Step 2: Solve for excluded values
$$x^2 – 9 = 0$$
$$x^2 = 9$$
$$x = \pm 3$$
Step 3: Express the domain
The function is defined for all real numbers except $$x = 3$$ and $$x = -3$$
Final Answer:
Domain: $$(-\infty, -3) \cup (-3, 3) \cup (3, \infty)$$ or all real numbers except $$x = \pm 3$$
⏱️ ACT Time Tip: This should take 45-60 seconds. Factor quickly and identify zeros!
Example 2: Function Transformations
Question: The graph of $$y = x^2$$ is transformed to $$y = -(x – 3)^2 + 2$$. Describe all transformations.
Step 1: Identify each transformation component
Compare $$y = -(x – 3)^2 + 2$$ to parent function $$y = x^2$$
Step 2: Analyze the negative sign
The negative in front means reflection across the x-axis (parabola opens downward)
Step 3: Analyze horizontal shift
$$(x – 3)$$ means shift right 3 units (opposite of the sign!)
Step 4: Analyze vertical shift
$$+2$$ means shift up 2 units
Final Answer:
Three transformations occur:
- Reflection across x-axis
- Horizontal shift right 3 units
- Vertical shift up 2 units
New vertex: (3, 2) and parabola opens downward
⏱️ ACT Time Tip: Remember the horizontal shift is OPPOSITE the sign. This takes 30-45 seconds once you know the pattern!
Example 3: Finding Range from a Transformed Function
Question: What is the range of $$g(x) = \sqrt{x + 4} – 1$$?
Step 1: Identify the parent function
Parent function is $$y = \sqrt{x}$$, which has range $$[0, \infty)$$
Step 2: Analyze transformations affecting range
• $$(x + 4)$$ shifts left 4 units (affects domain, not range)
• $$-1$$ shifts down 1 unit (affects range!)
Step 3: Apply vertical shift to parent range
Original range: $$[0, \infty)$$
Shift down 1: $$[0 – 1, \infty) = [-1, \infty)$$
Step 4: Verify with minimum value
The minimum occurs when $$\sqrt{x + 4} = 0$$, giving $$g(x) = 0 – 1 = -1$$
Final Answer:
Range: $$[-1, \infty)$$ or $$y \geq -1$$
⏱️ ACT Time Tip: Horizontal shifts don’t affect range; only vertical transformations do! This saves precious seconds.
Ready to Solve More ACT Math Problems?
Practice this concept with our timed ACT Math practice test. Get real test conditions, instant feedback, and detailed explanations for every question!
🚀 Start ACT Practice Test Now →📝 Practice Questions with Detailed Solutions
Test your understanding with these ACT-style practice problems. Try solving them independently before checking the solutions!
Practice Question 1
What is the domain of the function $$h(x) = \sqrt{2x – 6}$$?
📖 Show Solution
Correct Answer: C) $$x \geq 3$$
Solution:
For square root functions, the expression under the radical must be non-negative:
$$2x – 6 \geq 0$$
$$2x \geq 6$$
$$x \geq 3$$
💡 Quick Tip: For $$\sqrt{ax + b}$$, solve $$ax + b \geq 0$$ to find the domain.
Practice Question 2
The function $$f(x) = |x|$$ is transformed to $$g(x) = |x + 2| – 3$$. What is the vertex of $$g(x)$$?
📖 Show Solution
Correct Answer: A) (-2, -3)
Solution:
The parent function $$f(x) = |x|$$ has its vertex at (0, 0).
Transformations:
- $$x + 2$$: Shift LEFT 2 units (opposite of sign)
- $$-3$$: Shift DOWN 3 units
New vertex: $$(0 – 2, 0 – 3) = (-2, -3)$$
💡 Memory Trick: For $$f(x + h) + k$$, the vertex moves to $$(-h, k)$$. The horizontal shift is OPPOSITE the sign!
Practice Question 3
If $$f(x) = x^2$$ and $$g(x) = 3f(x)$$, which statement is true about the graph of $$g(x)$$ compared to $$f(x)$$?
📖 Show Solution
Correct Answer: C) It is vertically stretched by a factor of 3
Solution:
When a function is multiplied by a constant outside: $$g(x) = a \cdot f(x)$$
• If $$|a| > 1$$: vertical stretch
• If $$0 < |a| < 1$$: vertical compression
• If $$a < 0$$: also includes reflection
Since $$g(x) = 3f(x)$$ and $$3 > 1$$, the graph is vertically stretched by factor of 3.
Example: When $$x = 2$$:
- $$f(2) = 4$$
- $$g(2) = 3(4) = 12$$ (three times as tall!)
💡 Key Distinction: Multiplication OUTSIDE the function = vertical stretch. Multiplication INSIDE like $$f(3x)$$ = horizontal compression.
Practice Question 4
What is the range of the function $$p(x) = -2(x – 1)^2 + 5$$?
📖 Show Solution
Correct Answer: A) $$y \leq 5$$
Solution:
This is a parabola in vertex form: $$p(x) = a(x – h)^2 + k$$
Key observations:
- Vertex: $$(1, 5)$$
- $$a = -2$$ (negative) → parabola opens DOWNWARD
- Maximum value at vertex: $$y = 5$$
Since the parabola opens downward, the maximum y-value is 5, and it extends to negative infinity.
💡 Quick Rule: For parabolas, if $$a < 0$$ (opens down), range is $$y \leq k$$. If $$a > 0$$ (opens up), range is $$y \geq k$$.
💡 ACT Pro Tips & Tricks
🎯 The Opposite Sign Rule
For horizontal shifts, the transformation is OPPOSITE the sign inside the parentheses. $$f(x – 3)$$ shifts RIGHT 3, while $$f(x + 3)$$ shifts LEFT 3. This is the #1 mistake students make!
⚡ Domain Quick Checks
Scan for three danger zones: denominators (can’t be zero), square roots (can’t be negative), and logarithms (argument must be positive). No danger zones? Domain is all real numbers!
📊 Graph Reading Strategy
For range from a graph, trace horizontally from left to right and note the lowest and highest y-values the function reaches. For domain, look at the leftmost and rightmost x-values where the function exists.
🔄 Transformation Order Matters
When multiple transformations occur, apply them in this order: reflections first, then stretches/compressions, then shifts. But on the ACT, you can often identify each transformation independently!
🧮 Use Test Points
When unsure about transformations, plug in simple values like $$x = 0$$ or $$x = 1$$ into both the original and transformed functions. Compare the outputs to verify your transformation analysis.
⏰ Time-Saving Elimination
On multiple-choice questions, eliminate obviously wrong answers first. If asked for domain and you see “all real numbers” as an option but there’s a denominator, eliminate it immediately!
🎯 ACT Test-Taking Strategy for Functions and Graphs
Time Allocation
Allocate 45-90 seconds per function question depending on complexity. Domain/range questions should take 45-60 seconds, while transformation questions may need 60-90 seconds if they involve multiple steps.
When to Skip and Return
If a question asks you to analyze a complex graph with multiple transformations and you’re not immediately seeing the pattern, mark it and move on. These questions are often easier on a second pass when you’re not feeling time pressure.
Strategic Guessing
For domain questions, if you must guess, eliminate “all real numbers” if there’s any restriction visible (denominator, square root, etc.). For transformation questions, test the vertex or a key point to eliminate wrong answers.
Quick Verification Method
After finding domain or range, do a 5-second sanity check: Does your answer make sense with the function type? Square roots can’t have negative outputs (unless there’s a negative outside). Parabolas opening up have range $$y \geq k$$, not $$y \leq k$$.
Common Trap Answers
Watch out for these ACT traps:
- Horizontal shift sign confusion: They’ll offer both $$f(x – 3)$$ shifts right AND left as options
- Domain/range reversal: They’ll swap domain and range in answer choices
- Incomplete restrictions: For $$\frac{1}{(x-2)(x+3)}$$, they might only exclude one value, not both
- Stretch vs. compression: They’ll reverse whether $$2f(x)$$ stretches or compresses
Calculator Usage
Your calculator can verify transformations! Graph both the parent and transformed function to visually confirm shifts, stretches, and reflections. This is especially helpful for checking your work on challenging questions.
⚠️ Common Mistakes to Avoid
Mistake #1: Confusing Domain and Range
The Error: Stating the range when asked for domain, or vice versa.
The Fix: Remember: Domain = inputs (x-values), Range = outputs (y-values). Circle which one the question asks for!
Mistake #2: Wrong Horizontal Shift Direction
The Error: Thinking $$f(x – 3)$$ shifts left because of the minus sign.
The Fix: The horizontal shift is ALWAYS opposite the sign. $$f(x – h)$$ shifts RIGHT by h units.
Mistake #3: Forgetting to Factor Denominators
The Error: For $$\frac{1}{x^2 – 4}$$, only excluding $$x = 4$$ from the domain.
The Fix: Always factor! $$x^2 – 4 = (x-2)(x+2)$$, so exclude both $$x = 2$$ and $$x = -2$$.
Mistake #4: Misidentifying Parabola Range
The Error: Stating range as $$y \geq k$$ when the parabola opens downward.
The Fix: Check the coefficient of $$x^2$$. Negative = opens down = range is $$y \leq k$$ (maximum at vertex).
🌍 Real-World Applications
Understanding functions and their transformations isn’t just about passing the ACT—these concepts appear throughout STEM fields and everyday problem-solving:
Engineering & Physics
Engineers use function transformations to model real-world phenomena. A suspension bridge’s cable follows a parabolic function, and transformations help engineers adjust for different bridge spans and load requirements. Understanding domain restrictions is crucial when modeling physical constraints—a projectile’s height function only makes sense for $$t \geq 0$$ (time can’t be negative).
Economics & Business
Business analysts use function transformations to model cost structures and revenue projections. If a company’s profit function shifts due to increased production costs, understanding vertical and horizontal shifts helps predict new break-even points. Domain restrictions represent realistic business constraints—you can’t produce negative quantities!
Computer Graphics & Animation
Video game developers and animators use function transformations constantly. Moving a character across the screen? That’s a horizontal shift. Making an object larger or smaller? That’s a vertical or horizontal stretch. Understanding these transformations is fundamental to computer graphics programming.
These concepts also appear in college courses like Calculus, Linear Algebra, Differential Equations, and Statistics. Mastering them now gives you a significant advantage in STEM majors.
🎥 Video Explanation: Functions and Graphs
Watch this detailed video explanation to understand domain, range, and function transformations better with visual demonstrations and step-by-step guidance.
❓ Frequently Asked Questions (FAQs)
Q1: How do I quickly determine if a function has domain restrictions?
Answer: Scan for three things: (1) denominators with variables—set them ≠ 0, (2) even roots (square roots, fourth roots, etc.)—set the expression inside ≥ 0, and (3) logarithms—set the argument > 0. If none of these appear, the domain is typically all real numbers. This scan should take just 5-10 seconds with practice!
Q2: What’s the easiest way to remember horizontal shift directions?
Answer: Use this memory trick: “Do the opposite of what you see.” If you see $$f(x – 5)$$, your instinct says “minus means left,” but do the OPPOSITE—shift right. If you see $$f(x + 3)$$, do the opposite of “plus means right”—shift left. The horizontal shift is always counterintuitive! Another way: solve $$x – 5 = 0$$ to get $$x = 5$$, which is where the vertex moves horizontally.
Q3: Can I use my calculator to check function transformations on the ACT?
Answer: Absolutely! Graphing both the parent function and the transformed function is an excellent verification strategy. Enter $$y_1 = x^2$$ and $$y_2 = (x-3)^2 + 2$$, then compare the graphs. You’ll visually see the shift right 3 and up 2. This is especially helpful for complex transformations or when you’re unsure of your answer. Just remember to adjust your window settings appropriately!
Q4: How do I find the range of a function without graphing it?
Answer: For common functions, use these shortcuts: (1) For parabolas in form $$a(x-h)^2 + k$$, if $$a > 0$$ range is $$[k, \infty)$$, if $$a < 0$$ range is $$(-\infty, k]$$. (2) For square root functions $$\sqrt{x}$$ shifted vertically by k, range starts at k and goes to infinity. (3) For absolute value $$|x|$$ with vertex at $$(h,k)$$ opening up, range is $$[k, \infty)$$. Identify the function type, find the vertex or minimum/maximum, and apply the pattern!
Q5: What’s the difference between $$2f(x)$$ and $$f(2x)$$?
Answer: This is a crucial distinction! $$2f(x)$$ means multiply the OUTPUT by 2, causing a vertical stretch by factor of 2 (graph gets taller). $$f(2x)$$ means multiply the INPUT by 2, causing a horizontal compression by factor of 2 (graph gets narrower). Remember: transformation OUTSIDE the function = vertical change, transformation INSIDE the function = horizontal change. Example: if $$f(x) = x^2$$, then $$2f(x) = 2x^2$$ (steeper parabola) while $$f(2x) = (2x)^2 = 4x^2$$ (even steeper, but for a different reason—the input is doubled before squaring).
✍️ Written by Dr. Irfan Mansuri
Educational Content Creator & Competitive Exam Specialist
IrfanEdu.com • United States
Dr. Irfan Mansuri is a distinguished educational content creator with over 15 years of experience spanning high school, undergraduate, and postgraduate levels. As the founder of IrfanEdu.com, he has successfully guided thousands of students through competitive examinations, helping them achieve exceptional results and gain admission to their dream institutions.
📚 Related ACT Math Resources
Continue building your ACT Math skills with these related topics:
Quadratic Functions
Master solving quadratic equations, completing the square, and analyzing parabolas for ACT success.
Systems of Equations
Learn efficient methods for solving systems using substitution, elimination, and graphing techniques.
Exponential Functions
Understand exponential growth and decay, logarithms, and their applications on the ACT.
🎓 Explore our complete collection of ACT Math guides, practice questions, and test-taking strategies
Browse All ACT Prep Resources →🚀 Ready to Ace the ACT Math Section?
You’ve mastered functions and graphs—now put your skills to the test with full-length practice exams that mirror the real ACT experience!
Start Your Free ACT Practice Test →Understanding Graph Transformations: A Complete Guide
Graph transformations represent one of the most powerful tools in mathematics, allowing us to manipulate and understand functions in dynamic ways. When you master these techniques, you gain the ability to predict how changes to a function’s equation will affect its visual representation on a coordinate plane.
What Are Graph Transformations?
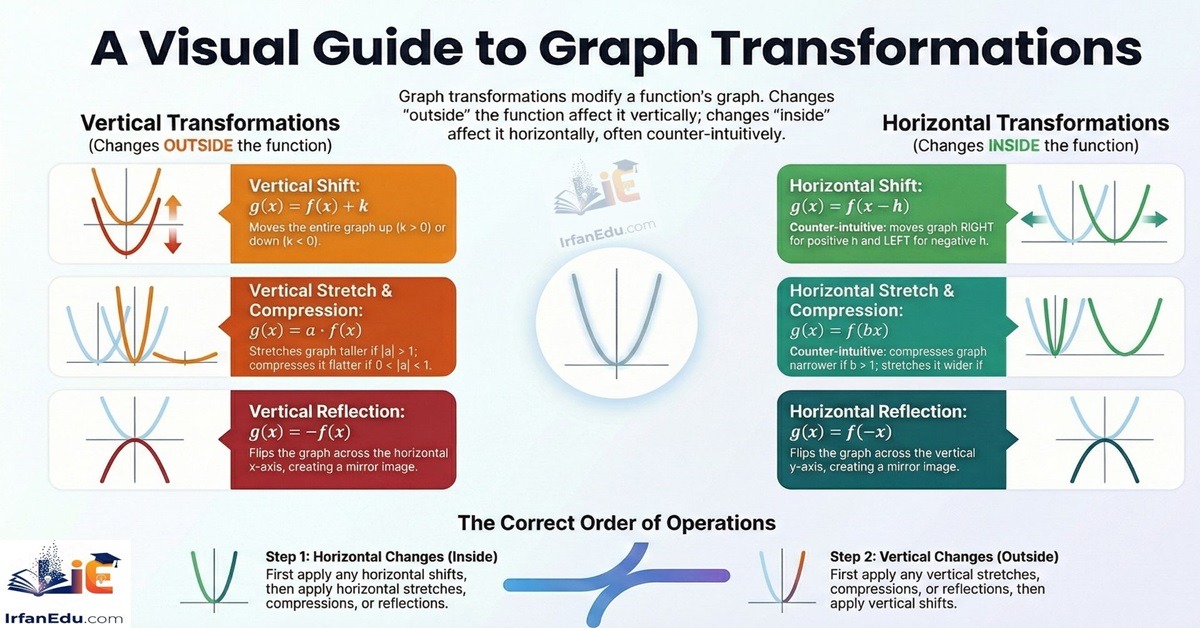
Graph transformations modify the position, shape, or orientation of a function’s graph without changing its fundamental characteristics. Think of transformations as instructions that tell you how to move or reshape a graph systematically. These modifications follow predictable patterns that mathematicians use to analyze complex functions by relating them to simpler parent functions [[2]](#__2).
Every transformation operates according to specific rules. When you apply these rules correctly, you can sketch transformed graphs quickly and accurately. Students often find that understanding transformations makes graphing functions much more intuitive than plotting points individually.
Types of Graph Transformations
Vertical Shifts
Vertical shifts move the entire graph up or down along the y-axis. When you add a constant to a function, you create a vertical shift. The transformation takes the form $$g(x) = f(x) + k$$, where k represents the number of units the graph moves.
If k is positive, the graph shifts upward. If k is negative, the graph shifts downward. For example, if $$f(x) = x^2$$, then $$g(x) = x^2 + 3$$ shifts the parabola up by 3 units. Every point on the original graph moves vertically by the same amount [[2]](#__2).
Horizontal Shifts
Horizontal shifts move graphs left or right along the x-axis. These transformations affect the input variable before the function processes it. The general form appears as $$g(x) = f(x – h)$$, where h determines the direction and magnitude of the shift.
Here’s where students often get confused: when h is positive, the graph shifts to the right, not left. When h is negative, the graph shifts to the left. For instance, $$g(x) = (x – 2)^2$$ shifts the basic parabola 2 units to the right. This counterintuitive behavior happens because you need a larger x-value to produce the same output [[2]](#__2).
Vertical Stretches and Compressions
Vertical stretches and compressions change how tall or flat a graph appears. When you multiply a function by a constant, you create this type of transformation: $$g(x) = a \cdot f(x)$$. The value of a determines whether you stretch or compress the graph [[0]](#__0).
When $$|a| > 1$$, the graph stretches vertically, making it appear narrower and taller. Each output value gets multiplied by a, moving points farther from the x-axis. When $$0 < |a| < 1$$, the graph compresses vertically, making it appear wider and flatter. Points move closer to the x-axis because you multiply each output by a fraction [[0]](#__0).
Horizontal Stretches and Compressions
Horizontal stretches and compressions modify the width of a graph. These transformations occur when you multiply the input variable by a constant: $$g(x) = f(bx)$$. The behavior of these transformations often surprises students because the effects appear opposite to what you might expect [[1]](#__1).
When $$b > 1$$, the graph compresses horizontally, appearing narrower. When $$0 < b < 1$$, the graph stretches horizontally, appearing wider. For example, $$g(x) = f(2x)$$ compresses the graph by a factor of $$\frac{1}{2}$$ because the function reaches the same output values in half the horizontal distance [[1]](#__1).
Reflections
Reflections flip graphs across an axis, creating mirror images. Two types of reflections exist: vertical reflections across the x-axis and horizontal reflections across the y-axis.
A vertical reflection occurs when you multiply the entire function by -1: $$g(x) = -f(x)$$. This transformation flips the graph over the x-axis. Every point $$(x, y)$$ becomes $$(x, -y)$$. A horizontal reflection happens when you replace x with -x: $$g(x) = f(-x)$$. This flips the graph over the y-axis, transforming every point $$(x, y)$$ into $$(-x, y)$$ [[2]](#__2).
How to Apply Graph Transformations
Step-by-Step Process
Applying transformations becomes straightforward when you follow a systematic approach. Start by identifying the parent function, then determine what transformations the equation indicates. Finally, apply those transformations in the correct order [[3]](#__3).
- Identify the parent function (such as $$x^2$$, $$\sqrt{x}$$, or $$|x|$$)
- Look for constants added to or multiplying the function
- Determine whether changes occur inside the function (affecting x) or outside (affecting y)
- Apply transformations in the proper sequence
- Sketch the transformed graph using key points
Order of Operations for Transformations
The order in which you apply transformations matters significantly. When you encounter multiple transformations in one function, you must apply them in the correct sequence to obtain accurate results [[3]](#__3).
For transformations inside the function (affecting x), apply horizontal shifts before horizontal stretches or compressions. For transformations outside the function (affecting y), apply vertical stretches or compressions before vertical shifts. You can apply horizontal and vertical transformations in any relative order since they affect different dimensions independently [[3]](#__3).
Practical Examples
Example 1: Combining Vertical Shift and Stretch
Let’s transform $$f(x) = x^2$$ into $$g(x) = 2x^2 + 3$$. This transformation combines a vertical stretch and a vertical shift.
First, we apply the vertical stretch by multiplying by 2. This makes the parabola narrower, with points moving farther from the x-axis. The point $$(1, 1)$$ becomes $$(1, 2)$$, and the point $$(2, 4)$$ becomes $$(2, 8)$$. Next, we add 3, shifting the entire stretched graph upward by 3 units. The vertex moves from $$(0, 0)$$ to $$(0, 3)$$ [[0]](#__0).
Example 2: Horizontal Compression with Reflection
Consider transforming $$f(x) = \sqrt{x}$$ into $$g(x) = \sqrt{-2x}$$. This transformation involves both a horizontal compression and a reflection.
The negative sign inside the function creates a reflection across the y-axis. The coefficient 2 creates a horizontal compression by a factor of $$\frac{1}{2}$$. The original function starts at $$(0, 0)$$ and passes through $$(4, 2)$$. After transformation, the graph still starts at $$(0, 0)$$ but now extends to the left, passing through $$(-2, 2)$$ instead [[1]](#__1).
Example 3: Complete Transformation
Let’s transform $$f(x) = |x|$$ into $$g(x) = -2|x – 3| + 1$$. This complex transformation includes four separate changes.
Start with the horizontal shift: subtract 3 from x, moving the graph 3 units right. The vertex shifts from $$(0, 0)$$ to $$(3, 0)$$. Next, apply the vertical stretch by multiplying by 2, making the V-shape steeper. Then apply the reflection by multiplying by -1, flipping the graph upside down. Finally, add 1 to shift the graph up 1 unit. The vertex ends at $$(3, 1)$$, and the V now opens downward [[3]](#__3).
Common Mistakes to Avoid
Confusing Horizontal Shift Direction
Students frequently make errors with horizontal shifts because the direction seems backward. Remember that $$f(x – h)$$ shifts the graph to the right when h is positive, not to the left. This happens because you need larger x-values to produce the same outputs. Think of it as the function “waiting” longer to reach each value [[2]](#__2).
Misinterpreting Horizontal Stretch Factors
Another common error involves horizontal stretches and compressions. When you see $$f(2x)$$, the graph compresses by a factor of $$\frac{1}{2}$$, not stretches by a factor of 2. The reciprocal relationship between the coefficient and the actual stretch factor confuses many learners. Always remember that larger coefficients create narrower graphs [[1]](#__1).
Applying Transformations in Wrong Order
Applying transformations in the wrong sequence produces incorrect graphs. You must perform stretches and compressions before shifts within the same dimension. For vertical transformations, stretch first, then shift. For horizontal transformations, shift first, then stretch. Following this order ensures accurate results [[3]](#__3).
Practice Problems
Problem 1
Describe the transformations applied to $$f(x) = x^2$$ to obtain $$g(x) = 3(x + 2)^2 – 5$$.
Problem 2
If $$f(x) = \sqrt{x}$$ passes through the point $$(4, 2)$$, what point does $$g(x) = 2\sqrt{x – 1} + 3$$ pass through?
Problem 3
Write the equation for the absolute value function that has been reflected over the x-axis, shifted right 4 units, and shifted up 2 units.
Real-World Applications
Graph transformations appear throughout science, engineering, and economics. Engineers use transformations to model how physical systems respond to changes in input parameters. Economists apply transformations when adjusting financial models for inflation or market shifts. Understanding transformations helps you interpret how modifications to one variable affect another in practical situations.
For example, if a company’s profit function follows a quadratic pattern, transformations help predict how changes in production levels or pricing strategies will affect overall profitability. Similarly, physicists use transformations to describe how wave patterns change under different conditions, such as changes in frequency or amplitude.
Key Takeaways
- Vertical transformations (outside changes) affect the y-values and include vertical shifts, stretches, compressions, and reflections
- Horizontal transformations (inside changes) affect the x-values and include horizontal shifts, stretches, compressions, and reflections
- Adding constants creates shifts, while multiplying creates stretches or compressions
- Negative signs create reflections across axes
- The order of transformations matters for accurate graphing
- Horizontal transformations often behave opposite to intuition
Summary
Mastering graph transformations empowers you to understand and manipulate functions efficiently. By recognizing how changes to equations affect graphs, you develop deeper mathematical intuition and problem-solving skills. Practice applying these transformations to various parent functions, and you’ll soon find that graphing complex functions becomes much more manageable. Remember to work systematically, apply transformations in the correct order, and always verify your results by checking key points on the transformed graph.
References
- Lumen Learning – Compressions and Stretches in College Algebra
- MathBitsNotebook – Horizontal Stretch and Compress Functions
- LibreTexts Mathematics – Transformation of Functions
- CK-12 Foundation – Function Graph Transformations
[pdf_viewer id="231"]